Website metrics give you information about how people interact with your website. With numerous metrics available, it can be challenging to determine which ones are important for growth.
The right set of metrics will give you consistent feedback on what is effective and what needs improvement. By tracking these metrics, you can make changes and achieve your marketing goals.
Continue reading to discover the key metrics for measuring website engagement and success in 2024.
What Are Website Metrics?
Website metrics are numbers and statistics that tell you how your website is doing. Think of them as a report card for your site. They show things like how many people visit your website (traffic), how long they stay (duration), which pages they look at, and whether they do what you want them to do, like buy something or sign up (conversion rates).
Importance of Website Metrics
Metric tracking on websites allows you to see what is effective.
It can, for instance, display the sources that drive the most traffic to your website. or the kind of content that converts. So you can focus more on what works for your brand.
Additionally, website analytics provide you with an objective perspective of how users and visitors engage with your website.
For example, a landing page with a high bounce rate may be a sign that users are not engaged with the design, experience, or content.
Finally, you can learn more about your ideal users by utilizing website metrics. They allow you to categorize website visitors based on their geolocation, traffic source, and device. Later on, this will enable you to target more of them.
Here is an illustration of Google Analytics data that displays users according to their device:
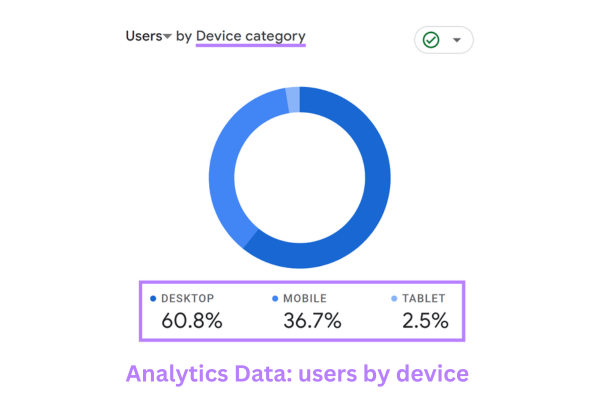
You may discover from a variety of data sources that the majority of your ideal customers are from U.S, find your website naturally through Google search, and use mobile devices. From these insights, you can improve the content and layout of your website to better cater to this target market.
How to Check Website Metrics
To efficiently check website metrics, first select an appropriate tool like Google Analytics for a broad overview or SEMrush and Ahrefs for more SEO-focused data.
Ensure the chosen tool is correctly installed on your site, for instance, by adding a tracking code on all pages if you’re using Google Analytics.
20 Website Metrics to Track for Growth in 2024
There are a lot of metrics that can help you understand how well your website is doing. It can be a bit overwhelming, especially if you’re new to this. But don’t worry, here are 20 simple and important metrics that can help you make better decisions for your website.
1. Total Number of Visits
The total number of visits is a measure of how many times people have come to your website during a specific time. It shows how visible and appealing your site is. If the number of visits is increasing, it means that your marketing, SEO strategies, or content are working well.
Keeping track of this number is important because it tells you how interested people are in your site and helps you see patterns in how visitors engage with it.
2. Total Unique Visitors
This metric keeps track of the number of new visitors to your website during a specific period, such as a day, week, or month. Think of it as a counter that only counts individuals who are visiting your website for the first time on a particular day.
Imagine there are two people, A and B, who visited your website in the past hour. User A went to your website one time, while user B went there twice. In total, there were three visits to your website, but only two unique visitors.
Average Visits Per Unique Visitor = Total visits ÷ Unique visitors
3. Traffic Sources
Traffic Sources refer to where your website visitors come from. These sources can include search engines, social media platforms, referral sites, or direct visits (when someone types your website URL into their browser).
Tracking these helps you understand how people discover your site, which channels are most effective, and where to focus your marketing efforts.
4. Page Views
Page views are a way to measure how many times people have looked at or loaded pages on your website. This number includes every time a page is opened or refreshed, even if it’s by the same person.
It helps you understand how much content is being read and which pages are the most popular.
5. Average Session Duration
Average Session Duration is a metric that measures the average length of time users spend on your website during a single visit or session.
It gives insight into how engaging and interesting your content is to visitors. The longer the duration, generally, the more engaged the audience.
On average, B2C websites have a session duration of 92.33 seconds. For B2B websites, the average session duration is slightly shorter at 77.61 seconds.
If your average score is higher than that, it means your website is performing well.
6. Pages Per Session
Pages Per Session is a metric that shows the average number of pages a user views during a single visit to your website. It helps you understand how engaging and navigable your site is—if users visit multiple pages, it suggests they are interested and easily finding more content to consume.
According to Databox, B2B companies typically have 1.89 pages per session as their median number. This means that having two or more pages per session is considered very good. If your pages per session metric is less than two, it may be a good idea to review your content strategy, website design, and ideal customer profile.
7. Bounce Rate
The bounce rate is a measure of the number of sessions where people spent less than ten seconds, viewed less than two pages, and did not make any conversions.
You can calculate your bounce rate using the following formula:
Bounce rate % = (100 × sessions under ten seconds, with no conversion, and fewer than two page views) ÷ total sessions
8. Conversion Rate
Conversion Rate is a key performance indicator (KPI) that measures the percentage of visitors to your website who take a desired action out of the total number of visitors.
The formula for calculating conversion rate is:
Conversion rate% = (Number of users who perform conversion actions ÷ Total visitor) × 100
9. Cost Per Conversion
Cost Per Conversion (CPC) is a measurement that determines how much money is spent for each conversion.
Conversion refers to desired actions taken by visitors, such as making purchases, signing up for newsletters, or any other goal a campaign is designed to achieve.
Cost Per Conversion = Total cost of campaign ÷ Number of user who performs conversion action
10. Keyword Rankings
When someone searches for something on the internet that relates to your business, your keyword ranking refers to where your website appears on the search engine results page (SERPS) for that specific search term.
If your website shows up as the third result on Google’s search page for a particular keyword, your keyword ranking for that term is three. You will have different rankings for each keyword. Ideally, you would want to have a high ranking for as many relevant keywords as possible.
For example, if your website sells pet products, it would be advantageous for you to have a high ranking for important keywords like “best dry food for kittens” “organic dog treats recipe,” and “durable chew toys for puppies.”
11. Organic Traffic
When you search for something online, the results you see can be either paid or unpaid. The unpaid results are called organic results, while the paid ones are ads.
The organic traffic metric is a way to measure how many people visit your website from unpaid search results. It shows how many people find your site naturally, without any promotion or ads.
12. Backlinks
Backlinks, also known as inbound links, are links found on other websites that direct people to your own website.
Imagine a scenario where a customer gives a positive review of your software product on a website like Trustpilot or G2. If that review includes a link to your homepage, it is considered a backlink.
13. Click-Through Rate (CTR)
This metric displays the number of viewers who clicked on your link as a percentage of all viewers. You can use it to calculate the number of impressions required to get a click.
Click-through rate = (Number of clicks ÷ Total impressions)× 100
14. Top Performing Pages
Top performing pages on a website are those that attract the most traffic, engage visitors effectively, lead to conversions, and meet specific objectives set by the site owner.
To find out which of your webpages are the most popular based on how many times they have been viewed, go to the “Reports” section in Google Analytics. From there, click on “Engagement” and then select “Pages and Screens.” You will see a list of your webpages, with the most viewed ones listed at the top.
15. Average Engagement Time
The average engagement time is the average length of time that people spend on a website or a particular page before they leave or move on to something else.
Average Engagement Time = Average length of time that people spend on a website or a particular page ÷ Active Users
16. Page Load Speed
Page load speed refers to the amount of time it takes, on average, for a webpage to fully appear on a browser window. The speed at which a webpage loads can be affected by factors such as the user’s internet connection as well as the amount of resources required to load the page.
According to Google: The probability of bounce increases 32% as page load time goes from 1 second to 3 seconds.
17. Crawlability
Crawlability describes how easily search engine bots can visit and move through a website’s pages to add them to their search results. This is important to make sure that all important information on a site is found and displayed in search engine results.
Go to “Settings” > “Crawl stats” on your free Google Search Console to find crawlability information.
18. Internal Linking
This metric shows how many links within your website lead to other webpages on your site. Just like external links, internal links also help to increase the credibility of a webpage.
19. Exit Rate
Exit rate is a metric that measures the percentage of visitors who leave a website from a specific page without interacting further with the site.
20. Customer Lifetime Value (CLV)
Customer Lifetime Value (CLV) is a metric that represents the total amount of money a customer is expected to spend with a business throughout their entire relationship.
Customer Lifetime Value = (Total Revenue ÷ Total Customers) × Average Customer Lifespan
In conclusion, tracking website metrics is essential for optimizing growth and performance online. By monitoring these key indicators businesses can make informed decisions to improve their online presence.